← Semiconductors 101: a free course following the life of a chip
Semiconductors 101, unit 19
Yield and wafer maps
What a fab finally hands over is good chips. Yield says what share is good, a wafer map says where the bad ones are, and only the two together tell you which step to go back and look at.
Goals
- Explain how yield is calculated, why tiny losses at each step multiply into big ones, and, using defect density, why bigger chips have lower yield.
- Tell WAT from a wafer map: one measures test keys in the scribe lines, the other tests every single chip.
- Say what kind of problem a shape of failures on a wafer map often points to, and explain how a new process's yield climbs round by round (yield learning) and why the climb slows.

Step by step
- Count what share of the chips are good (the yield), and get every step as close to ruining nothing as possible.
WhyYield is multiplied step by step: if each step ruins only 1 in 1,000, about 60% is left after 500 steps.
If notAny step that drifts a little gets multiplied in; with low yield each good chip costs more, and the quantity promised to the customer may not be ready in time.
- When the wafer is finished, first measure the test keys in the scribe lines (WAT).
WhyTest keys go through every step together with the chips, and only a few positions per wafer are measured, much faster than testing chip by chip.
If notA chip holds too many switches to work back from the whole chip; skip WAT and a lot that went off shows up only in the slower chip-by-chip test.
- Once WAT passes, test every single chip with a probe card (wafer sort), and sort the failures by how they failed.
WhyWAT only answers "did the process go off"; it can't say which chips are bad.
If notWithout testing every chip, good and bad can't be told apart, and bad ones could be sent on to packaging.
- Draw the results by position as a wafer map and look at the shape the bad chips form.
WhyShapes often point to different steps: a ring at the edge first points to steps that must be even across the wafer, a line or an arc is often a scratch.
If notThe yield number alone says how many are bad, not where.
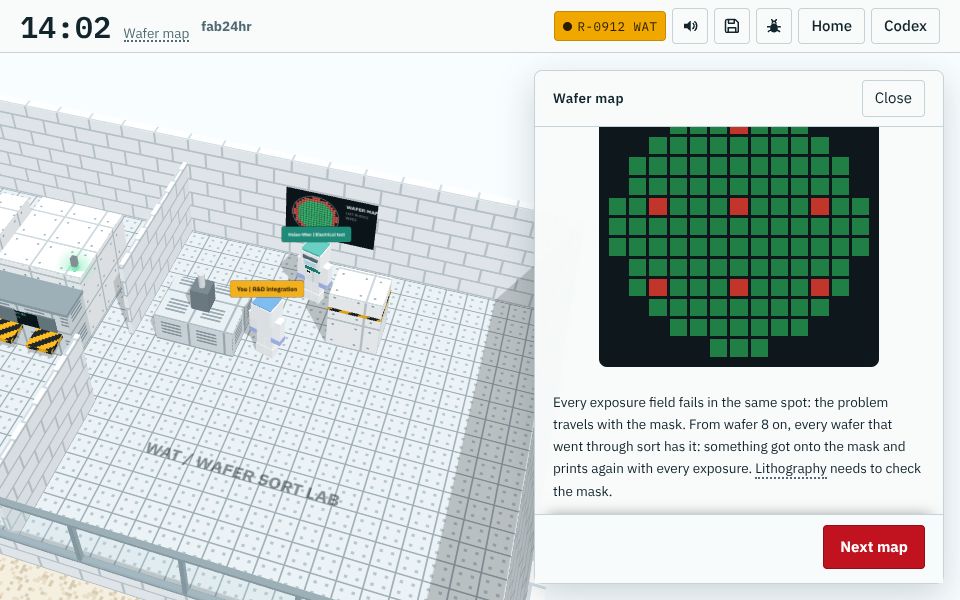
A screen from the game fab24hr; the tools, lot numbers and people are fictional. Play this part in the game → 
A screen from the game fab24hr; the tools, lot numbers and people are fictional. Play this part in the game → - Rule out the measurement first: clean the probe card's needles and probe again.
WhyDirty needle tips make the resistance read high, which looks just like a process problem.
If notSkip this and a measurement problem may be chased as a process problem.
- Compare wafer by wafer, list the tools the bad wafers went through, and finally find the failing spot and cut the chip open there to look at the cross-section.
WhyA sudden start often means something changed at that moment, and the one tool all the bad wafers shared is the prime suspect.
If notA shape only narrows things down; without cutting it open, there is no telling whether a hole wasn't filled, a line broke or an extra layer appeared.
- Once the cause is found, fix it (change a setting, repair the tool or replace the mask), check that the next lot's numbers come back, then move on to the next kind of failure.
WhyA shape is only a clue, so a fix needs the numbers to come back; each fix lifts yield another stage, and what's left gets smaller and harder to find, so the climb slows.
If notFix the wrong thing, or take one lucky lot as proof it's solved, and the yield stalls halfway.
Key ideas
Yield is multiplied step by step, and depends on chip size
Yield is the share of the chips made on a wafer that come out good: 90 good out of 100 is 90%. A wafer goes through hundreds of steps, and each step ruins a few more of the good chips that are left; in a simplified example where every step ruins only 1 in 1,000, only about 60% is left after 500 steps. Chip size matters too: small defects such as particles land on the wafer at random, like dust, and one killer defect is enough to ruin a chip. The average number of killer defects per square centimeter is called defect density, and it tells you how clean and steady the line is; multiplied by the chip's area, it gives how many defects each chip gets on average, and the more each gets, the fewer chips escape with none. Say 100 killer defects land on one wafer, in the simplest model completely at random (ignoring the partial chips at the edge): cut it into 1,000 small chips and about 905 are good, a yield of about 90%; cut it into 100 big chips and only about 37 are, under 40%. Make the chip 10 times bigger and a wafer holds 10 times fewer, yet the good ones drop more than twentyfold; the same line, just as clean, gives very different yields, so the yields of chips of different sizes can't be compared directly.
First, the test keys in the scribe lines (WAT)
Between the chips run narrow scribe lines, where the saw will cut the wafer apart in the end. Since that part is cut away anyway, small structures made only for measuring are placed there, called test keys: a single transistor, a long resistor, a chain of thousands of contacts (one break and the whole chain is open). They are made at the same time as the chips and go through exactly the same steps. A chip holds so many switches that it is hard to work back from the whole chip to the numbers of one kind of transistor, so when a wafer is finished the test keys are measured first; this is WAT. Only a few positions per wafer are measured, much faster than testing chip by chip, so WAT is often among the first places a whole lot shows it went off; if one item is out, the lot is put on hold.
Then every chip is tested and drawn as a wafer map
WAT answers "did the process go off", but can't say which chips are bad. So next comes wafer sort: very fine needles on a probe card touch each chip's contacts and test it with power on, every single chip, not a sample. The results are drawn by position as a wafer map, one color for good and one for bad. The shape of the bad ones tells a story: scattered with no pattern looks more like particles landing at random; a ring at the edge first points to steps that must be even across the wafer, such as film, etch, polishing and heating; a line or an arc is often a scratch; a neat grid, spaced exactly one scanner exposure field apart, often follows the mask.
From the shape back to the step, one failure at a time: yield learning
When a new process first goes through a pilot run, the yield is often low, and it is pulled up round by round; this is yield learning, and drawn as a graph it is what the news calls a "yield ramp". After wafer sort, the failures are sorted by how they failed, and the most common kind is tackled first, because fixing it raises yield fastest. A shape only narrows things down; it isn't the answer. The first move is often to suspect the measurement: if the probe card's needle tips are dirty, the resistance reads high and looks just like a process problem, so the needles are cleaned and the chips probed again. Then the wafers are compared one by one to see whether every wafer has it or it starts from a certain wafer, the tools the bad wafers went through are listed to find the one they all shared, and finally electrical tests narrow the failure down to a tiny area, and the chip is cross-sectioned there and looked at under an electron microscope. After a setting is changed or a tool repaired, the next lot's numbers have to come back before moving on to the next kind. Early on there are often a few big systematic problems, with failures in a ring or a grid; later, what's left is smaller and harder to find, and much of it is random defects, which come down mainly through a cleaner line that pushes defect density lower bit by bit, so the climb slows.
Common misconceptions
- People sayLow yield means the chips you buy are more likely to break.
- In factOnly partly true. Every chip is tested before it ships, and most of the bad ones are caught, so the most direct effect of low yield is that each good chip costs more, and there may not be enough of them. But testing only asks "does it work now?" Some defects aren't big enough to kill a chip right away; they leave a weak spot that passes every test and fails within the first weeks to months of use, an early-life failure. Studies have found that on wafers with poor yield, the chips that passed are also more likely to fail early, and the same goes for good chips in an area where many failed. So products with strict requirements get one more screen, such as burn-in, or wafers whose yield is clearly worse than usual are set aside.
- People sayOnce you see the shape on a wafer map, you know the cause.
- In factA shape only "often points to" something; it isn't the answer. A grid of failures may follow the mask, or it may be one group of needles on the probe card, which makes it a measurement problem. Real wafer maps often show two shapes on top of each other. So the measurement is ruled out first, the tool records are checked, and the chips are cut open before anyone is sure.
Read
- What does "yield" mean in chip news, and why does 1% matter so much?
- Why do bigger chips have lower yield? Defect density, yield models and how yield improves
- What is WAT, and how does a wafer map show what went wrong?
Play
Think
- Yield rises from 90% to 95%. What does that mean for the fab, for the company buying the chips, and for the people using the product?
- Failures on a wafer map form a grid: it could be the mask, or it could be the probe card. How much effort would each take to check? Which would you check first, and why?
Teaching materials: slides
The key ideas, diagram, machines and questions of this unit as a slide deck, ready to project or to put into your own handouts.
Download slides (PPTX)223 KBDownload slides (PDF)246 KB
Free to use in class and for non-commercial teaching. Please credit fab24hr. Do not sell it or present it as your own work. Spot a mistake? Report it
Cite this article"Semiconductors 101, unit 19:Yield and wafer maps" fab24hr, updated . https://fab24hr.com/en/learn/yield/